Dashboard Overview
The Pinokio Dashboard is the intuitive to use web UI where you view results from Post-bid, run reports and check the health of your integrations. Every Pinokio customer gets access — your account manager will set up your team’s logins as part of onboarding.
Analytics
Section titled “Analytics”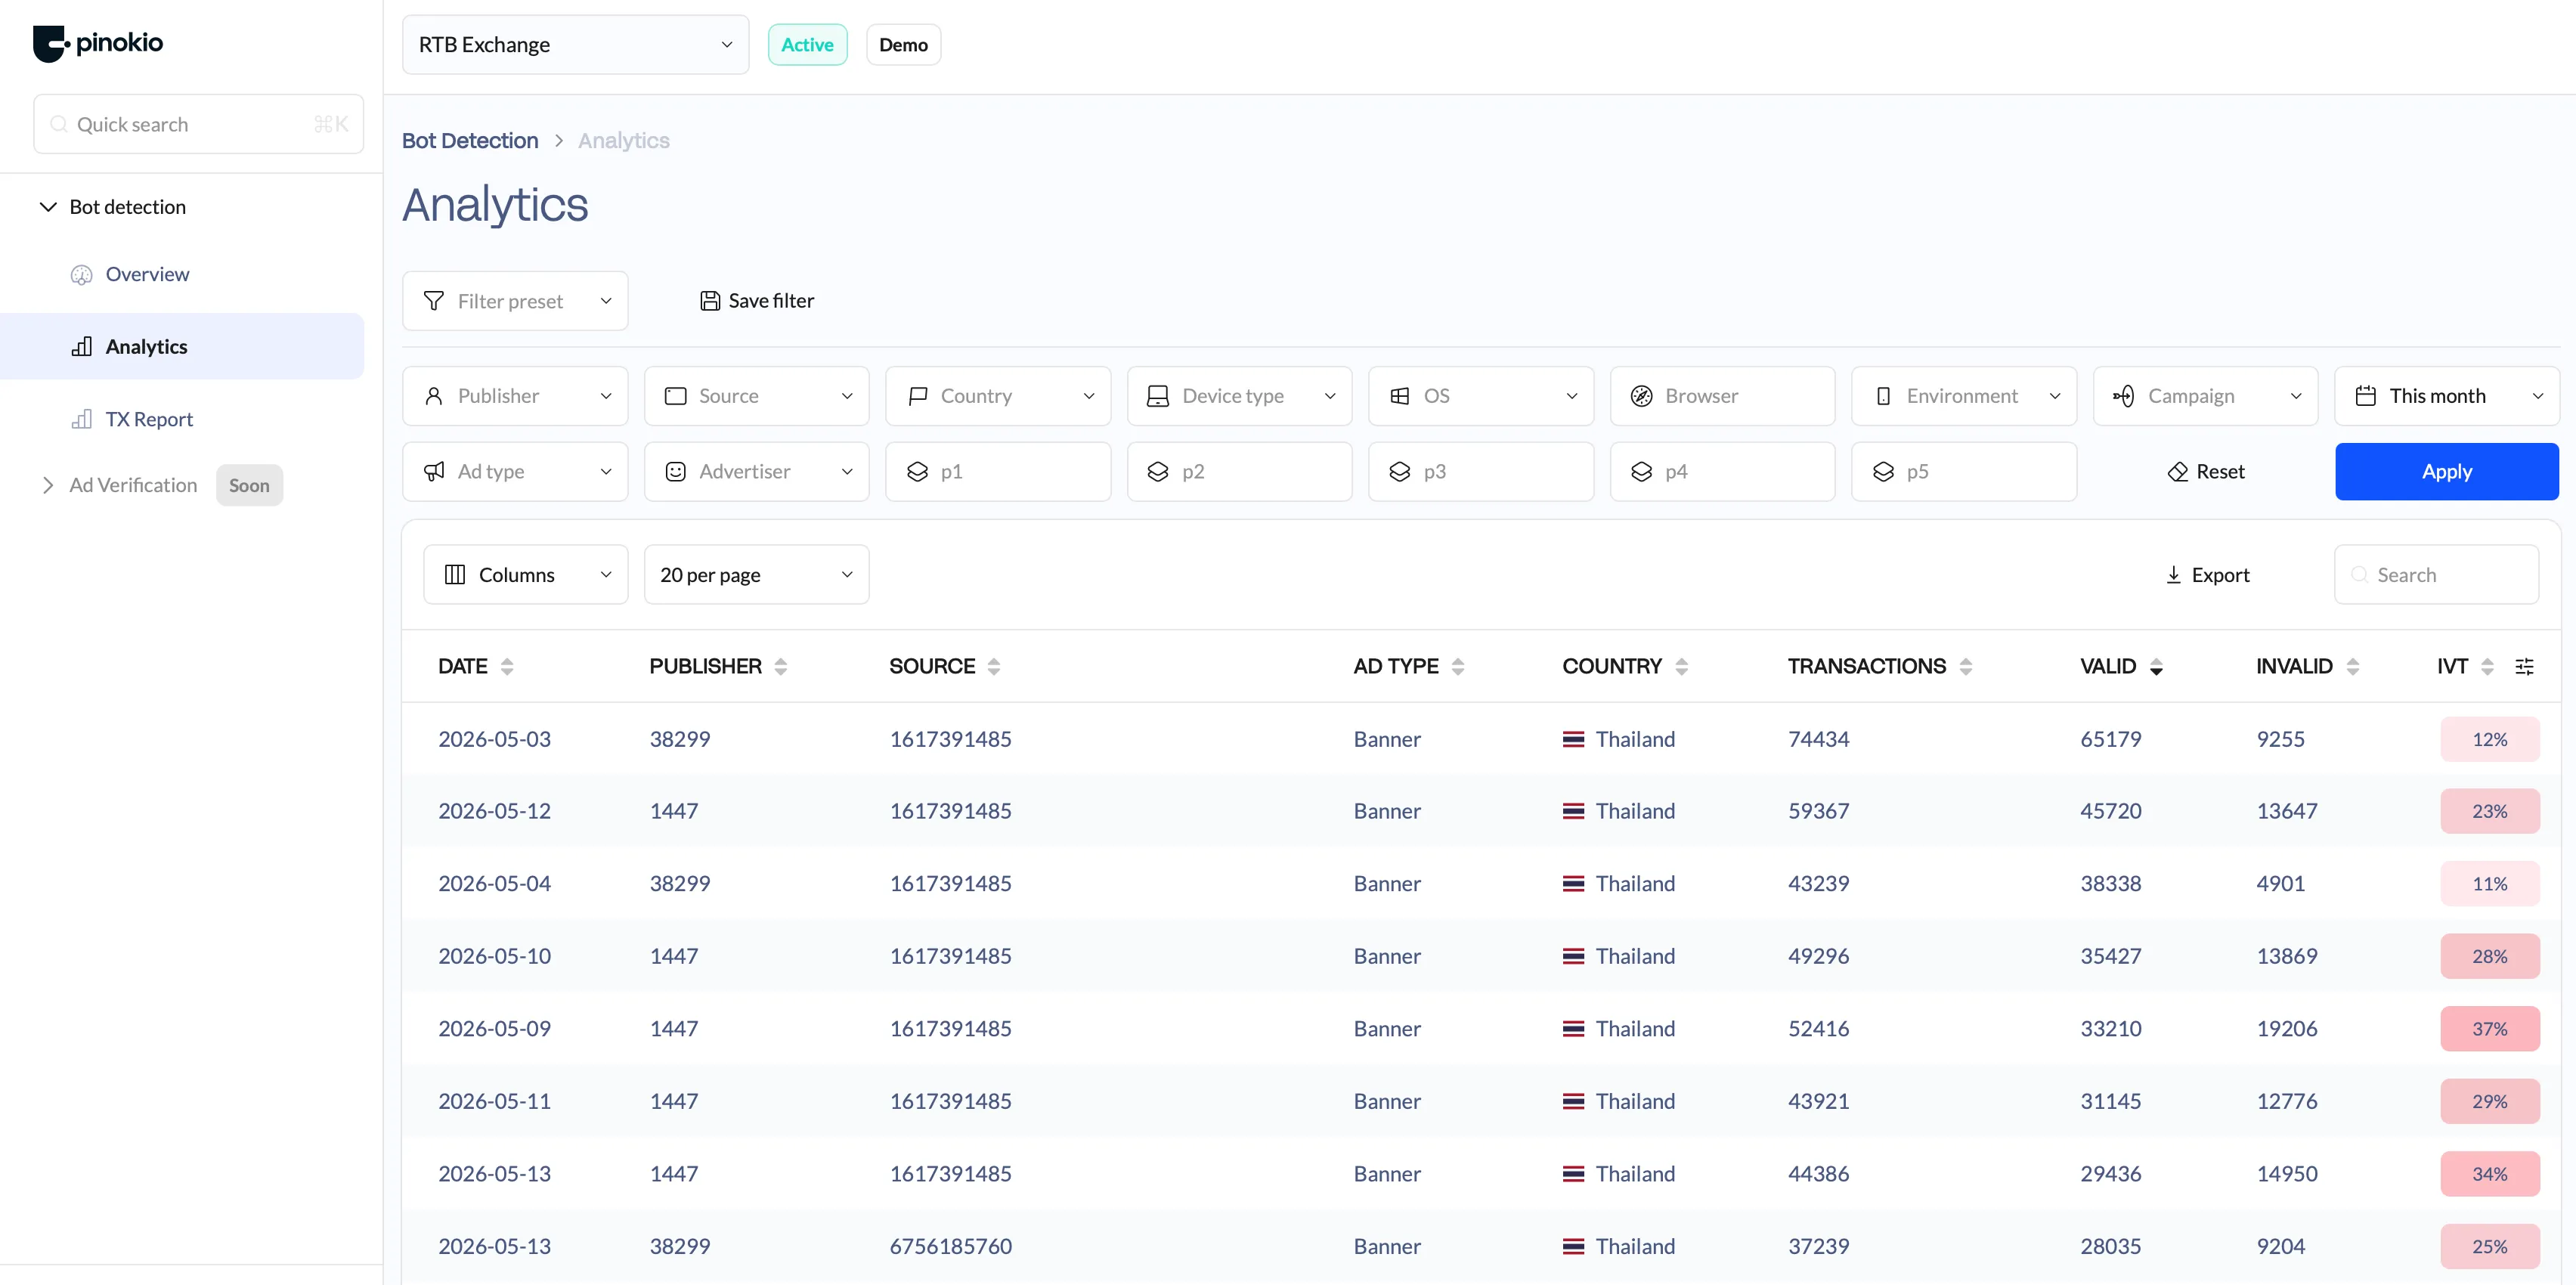
Analytics is the detailed reporting page for Post-bid data. It gives you a near-real-time view of your ad traffic broken down by device, OS, GEO, source and etc.
The page is split into filters at the top and a set of data sections below them.
By enabling or disabling columns you can group data by different dimensions.